IF-Filters in Early French Superheterodyne Radio Receivers
IF-Filters in Early French Superheterodyne Radio Receivers

IF-Filters in Early French Superheterodyne Radio Receivers
1 Introduction
When this report was first published some time ago in German, Ernst Erb considered the topic as being of interest to a wider community, and he encouraged me to prepare an English version. Here is the result:
My collection includes a number of early French superheterodyne radios. Amongst them there are some battery operated sets dating back to the second half of the 1920s ( DUCRETET Supermodula à 5 lampes, PATHEDYNE SB), some home brew kit-radios of the same era, and a french mains-operated radio made in 1933 (LAGIER ZZ). At some point it struck me that these sets showed a number of features I had never seen in other radios of that period. Obviously, the basic layout of all these sets followed the standard scheme of every superheterodyne receiver: Mixer – IF-Amplifier – Demodulator – AF-Amplifier, but looking more closely one finds some interesting details:
- The mixer stage of these sets always used a so-called ‚Bi-Grille‘(double-grid) tube, mostly an A441, DZ1T, U409d, TE41 or similar. These tubes work with plate voltages as low as 30 – 50 volts.
- The intermediate frequency ranged from 40 – 80 kc. From the present point of view this is difficult to understand, since even with good pre-selection one should think that there must have been a high risk of mirror-frequency interference. But one has to keep in mind that there were only few radio stations around, and therefore the risk of distorted reception due to mirror-frequency interference was accordingly small.
On top of that the cut-off frequencies of the triodes used for IF-amplification at that time (RE074, A409, TA09, TA10 etc) was very low. Logically, in the interest of achieving a sufficiently high IF-amplification one had to stick to a low IF.
Furthermore one must remember that lots of these radio sets were operated using a frame areal, the directional character of which helped suppressing the reception of unwanted stations – provided that these were located in a different direction compared to the station in view.
- An interesting constructional feature of the IF-filters is that the majority did not use any shielding. To avoid coupling between the IF-stages the distance between the filters was chosen sufficiently wide. In cases where the chassis dimensions did not allow sufficient spacing, magnetic coupling between the filters was reduced by tilting filter axes by 90°. Interesting to remark that they did not use the Hazeltine angle to achieve optimum decoupling. Presumably this was to avoid paying patent royalties.
- Many of these early radios used wood and/or Ebonite as a material for the cabinet walls and chassis. This means that IF-filters could be mounted directly on any surface without running the risk that the magnetic stray field would cause eddy currents in neighboring metallic structures and thus reduce coil inductance and Q-value. The situation changed when metallic chassis were introduced. As is seen in the LAGIER ZZ, the manufacturer still used unshielded IF-Filters with 4-pin European base, but these were put on “stilts”, i.e. on high sockets that guaranteed sufficient space between the filter coils an the conductive (aluminium) chassis surface.
- Selectivity and gain of the IF-amplifier were frequently boosted by using a detector stage with a regenerative circuit, in which feedback was achieved using a coil variometer. The following 2 pictures show the feedback variometers in a DUCRETET Supermodula à 5 lampes and a PATHEDYNE SB. The big coils on top are the IF-Filter coils, the small, rotatable coils below are the feedback coils (blue arrows).
.jpg)
.jpg)
- The reason for using a variometer rather than a variable capacitor in the feedback loop of the regenerative detector stage is in the low IF: A capacitive feedback would have required a variable capacitor of very high value.
The following picture shows the circuit diagram of a DUCRETET Supermodula à 5 lampes, a typical example of the schematics of French battery operated superheterodyne radios of the late twenties. Plate voltage supply (+40V, +80V) connections are drawn using bold lines.

The RF-signal picked up by a frame antenna (‚cadre‘) and tuned by a variable capacitor is put directly on grid 2 of a double grid mixer tube (Bi-grille). The first IF- band-pass filter using parallel caps of 350pF (0.35/1000 µF=0.35 nF = 350 pF) and 400pF is not directly connected to the mixer tube plate but via a secondary winding on the oscillator coil. The oscillator circuit also uses a variable cap for tuning and its hot end is connected directly to grid 1 of the double grid mixer.
The first IF-filter is followed by the only IF-amplifier triode, the output signal of which is fed into the regenerative detector. It seems worth noting that inductive feedback (indicated by a curved arrow) is not made to the grid circuit of the detector triode, but to the grid of the previous tube, i.e. the IF-amplifier triode.
The transformer following the detector tube is an audio frequency type with a parallel capacitor that bypasses RF to ground.
In order to reduce plate voltage battery current drain, one could choose between one stage and two stage audio amplification. The second audio amplifier tube is connected to the plate voltage supply only when a headphone or speaker is connected to Jack 2 (BF = Basse Frequence = Low Frequency).
The following report is focused on the description of the IF-filters encountered in French radio sets of my collection, mentioned initially. The majority of these filters could easily be disassembled and photographs will show their unusual construction.
Two different methods were then used to measure their RF-parameters:
- a simple ‘Exciter’ was used to measure the resonance frequencies and
- a more sophisticated method employing a sweep generator and spectrum analyzer to measure both, center frequencies and passband curves. The result of the second measurement campaign will be described in part 2 of this report.
Finally, a comparison of the results of the two measurement strategies - simple vs. sophisticated - will demonstrate up to which point a simple ‘Exciter’ can serve as a useful tool when repairing vintage radio sets and in which cases the measured frequencies could be dubious and should be confirmed by more precise measurements.
2 Resonance frequency measurements using an ‘EXCITER’
2.1 The working principle of an 'EXCITER'
In the first measurement campaign the resonance frequencies of the IF-filters were measured using an ‘Exciter’ i.e. a device that stimulates a passive LC circuit to oscillate. The output of the 'Exciter' is simply connected to an oscilloscope or even easier to a frequency counter, which will directly show the resonance frequency of the 'excited' LC-circuit.


The circuit diagram of such a device was proposed for example in a publication by Ing. Guenter Peltz in the German Radio/TV Journal FUNKSCHAU in 1971 „Zweipolige Oszillatorschaltungen für Parallel- und Serienresonanz“. The simple schematic is shown above on the left (Bild 9).
This schematic proposed by Peltz differs from the well-known emitter coupled oscillator shown on the right (Abb. 18.10 from Tietze-Schenk) in only one point: The RF-signal output of the emitter-coupled oscillator consisting of T1, T2 and R1 is buffered by an emitter-follower T3. Obviously, the low output impedance of the emitter-follower has the advantage that the Exciter can be connected to an oscilloscope or a frequency counter using a long coaxial cable without influencing the oscillation frequency of the circuit to be measured.
NB: The emitter-coupled oscillator must not be confused with the similar sounding ECO oscillator!
In the present set-up my ‘Exciter’ uses 3 transistors BF173, but the exact type of the transistor is not a critical issue. For high frequency operation it is clearly advantageous to use transistors that have a transit frequency of a few hundred Mcs.
Compared to other schemes that can be used to make an LC-circuit oscillate, the Exciter has the following advantages:
- It does not require any coupling components having a frequency dependent impedance.
- It needs very few components.
- It will work with a very low supply voltage, e.g. 1.2V from a NiCd rechargeable battery.
- Its supply current is surprisingly low: <1mA
For optimum operation in terms of trustworthy frequency indication, the variable resistor R1 in the common emitter connection of T1 and T2 must be adjusted to such a point that the LC-circuit is just above the threshold of oscillation onset. With decreasing value of R1 the RF amplitude increases and at some point the base-collector diodes of T1 and T2 start conducting. This leads to amplitude clipping and the previously harmonic oscillation passes over to a relaxation oscillation with lower frequency. For more information on this point see the article of Jochen Bauer: 'Relaxation Oscillations in LC-Oscillators'.
The EXCITER proved to be a very useful instrument for the repair of vintage radio sets, in particular in such cases where after replacement of all obviously defective components the set still didn’t work with sufficient sensitivity or/or selectivity.
Defective RF-components like open or short-circuited broken filter capacitors could easily be identified by comparing the resonance frequency indicated by the Exciter with the nominal resonance frequency of the circuit. Performing the Exciter measurements, nothing has to be demounted. This is particularly useful when measurements have to made in radio sets with very densely packed components (e.g. PHILIPS Philetta).
Peltz claimed that the ‘Exciter‘ can be used to stimulate LC- circuits whose resonant frequencies are well above 100 Mcs. This could in principal be confirmed by using transistors with a very high transit frequency (BFY90, BFX89). One has to keep in mind, however, that the parasitic impedances introduced into the circuit by the 'Exciter‘ itself, will shift the resonance frequency of the DUT to lower values. While for low frequencies circuits this effect can be neglected, it will lead to a progressive falsification of the result as frequencies increase.
2.2 The practical setup of an 'Exciter‘
As shown in the following pictures, the entire ‘Exciter’ circuit including a NiCd rechargeable battery could be accommodated in a small plastic box.


All components of the circuit were soldered directly on a double layer printed circuit board having an eyelet matrix on one side and a compact copper-silver-coat on the other. The latter provides a well defined ground plane. The 3 transistors stick in holes drilled into the PCB and their metal bodies were soldered directly on the ground plane (red arrows).
.jpg)
.jpg)
3 Investigated Filter Types
3.1 ‘GAMMA’ – French enterprise producing RF components for home-brew and commercial radios


Characteristic features:
Housing: Top and base plate: Ebonite (hard rubber), transparent cylinder: celluloid, base: 4-pin European.
Type: Strongly coupled IF-transformer (k=0.5) using cheese-wound coils. Secondary (top coil) tuned to a nominal frequency of 55 kcs using a parallel MICA capacitor 225 pF.
The following 2 pictures show the test-equipment that was used for all filter types described hereafter. The settings were: Oscilloscope: Vert 200mV/div, Time base 5µs/div. Frequency counter: Gate Time: 100ms. The oscilloscope was used to make sure that the waveform of the EXCITER output is sinusoidal and the amplitudes are not clipped (risk of relaxtion oscillatons - see remarks in sect. 2.1)
The resonance frequency obtained using the ‘Exciter’ is 51.04 kcs, in good agreement with the stamp on the top plate 'ACCORDÉ SUR 55KC'.
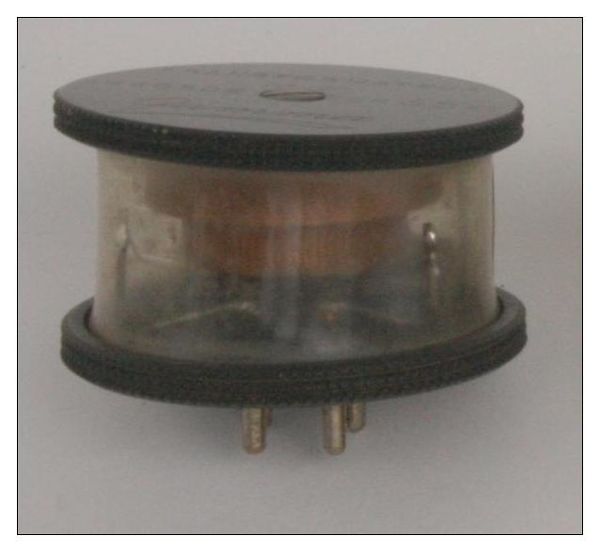
3.2 ‘SOLENO’ – French enterprise producing RF-components for home-brew radios


Characteristic features:
Housing: Ebonite top and bottom plate held in an aluminum drum.
Type: Strongly coupled IF-transformer (k=0.71) using arbitrarily - wound coils on Ebonite body. Unlike the other filter types described in this report, the secondary of the SOLENO filters can be tuned by a variable capacitor, integrated into the filter housing. The capacity range indicated on the top label is C= 0.01 ↔ 0.50. Units are 1/1000 µF, which means that the capacity could originally be adjusted between 10 pF and 500 pF. Verification of the range in the course of the present investigations gave 135 - 500 pF. The maximum value could thus be confirmed, while the minimum value is much higher. This dicrepancy will most probably have a mechanical background. Due to material fatigue, the capacitor wafers do not spread open as widely any more as they once did.This means that even when the adjustment knob is fully released, the capacity does not drop to the original low value.
Resonance frequency range measured with the ‘Exciter’: 41 – 77 kcs.
Among the filters investigated in the course of these investigations, the ‘Soleno‘ filters are the only ones that employ a metal shield – probably not only to improve mechanical stability but also to improve decoupling between neighboring filters. The question is whether the manufacturer was aware of the fact that this shielding had an influence on coil induction ‘L’. To give an impression on how strongly this metal shield influences the coil induction, this parameter was measured with and without shield. These were the results:
Primary: no shield -> L=12.2 mH ... with shield -> L=10.9 mH -> Reduction = -10.7%
Sekundary: no shield -> L=33.0 mH ... with shield -> L=28.1 mH -> Reduction = -14.8%
A detailed discussion of the influence of metallic shielding on coil induction and various methods of coil inductance tuning is found in Dietmar Rudolph’s et al contribution "Abgleich von Spulen (Inductance tuning of coils)". The following two graphs were extracted from this article:

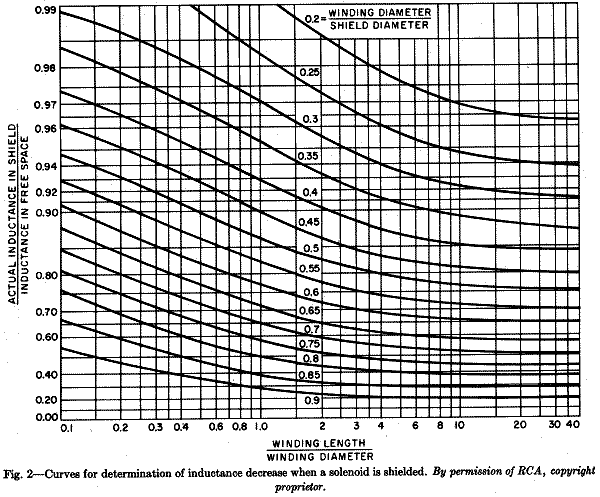
The graphs show that coil inductance drops
- with decreasing distance between shield and coil
- with increasing ratio of coil length to coil diameter
3.3 'INTEGRA‘ Model <412>


Used in radio model LAGIER ZZ.
Characteristic features:
Housing: Ebonite top and bottom plate, transparent cylinder: celluloid, base: 4-pin European
Type: Weakly coupled IF-band-pass filter (k=0.09) using cheese-wound coils. Primary and secondary have parallel MICA capacitors of nominally 500 pF. Checking the values with an R&S 'KARU' capacitance meter resulted in 495 pF and 480 pF.
Resonance frequencies given by ‘Exciter’: Primary: 61.9 kcs, secondary: 67.3 kcs.
3.4 ‚INTEGRA‘ model <406>


Used in radio model LAGIER ZZ
Characteristic features:
Housing as ‘INTEGRA’ model <412>.
Type: Low pass π-filter using a series inductor of L=63 mH and two 4000 pF MICA capacitors (nominal value), sitting on top of the coil. Measurement of the filter capacitors resulted in values of C1=3900 pF and C2=4200 pF. This filter is inserted between the demodulator and the input of the AF amplifier to hold back residual RF.
The EXCITER was connected across the series inductor. The capacitors lead from each end of the inductor to ground, i.e. their lower ends are connected to eachother. This means that the Exciter 'sees' a resonant circuit consisting of the inductor and a parallel capacitor of C=C1 • C2 / (C1 + C2) = 2030pF
The resonance frequency shown by the Exciter, which is identical to the cut-off frequncy of the low pass filter was 14.2kcs. A calculation using L=63mH and C=2030pF gives 14.1kcs.
This means that the Exciter can even be used to measure the cut-off frequencies of low-pass or high-pass filters.
By the way: A calculation of the characteristic impedance of the filter gives Z=2.8 kΩ
3.5 PATHE Pathedyne SB

Used in radio model PATHÉ Pathedyne SB. The set used an Ebonite chassis. Judging from the hand-written numbers on the cardboard bodies of the coils, the production period must have been towards the end of 1927: 13.12.1927, 19.12.1927 and 22.12.1927.
Characteristic features:
Housing: Cardboard, coils arbitrarily wound on wooden cores.
Type: Strongly coupled IF- band-pass filter (k=0.43), located between the last IF-stage and the feedback demodulator stage, both using tubes A409. Primary and secondary have parallel MP capacitors made by the French company ‘V. ALTER’. Nominal capacity values are 250pF primary and 350pF secondary (values are written in an usual way: 3.5/10000 µF means 350 pF. Over the past 90 years the values dropped to 215 pF and 290 pF, respectively.
Attempting to measure the primary and secondary resonance frequencies of this filter using the ‘Exciter’ proved unexpectedly problematic. To make sure that no other components influenced the resonance frequencies, the filters were removed from the chassis wiring. Nevertheless, the frequency indication hopped between 41 kcs and 65 kcs. This never before observed phenomenon occurred for both, the primary and the secondary circuit. In the beginning it was suspected that there was a bad contact, but after re-soldering all points, the problem was still there.
Since this effect was not observed when measuring the weakly coupled INTEGRA <412> band-pass filter above, it had to be caused by the much stronger coupling of the Pathé filter. In fact, the reason for this phenomenon is the so-called 'Jump-Effect'. This ‚Jump-Effect‘ was first observed in the early days of radio transmitters, where too strongly coupled resonance circuits were found to have two resonance points.
Part 2 of this report will describe the detailed frequency response of these filters. It will be shown, that the two 'jump‘- frequencies 41 kcs and 65 kcs observed using the ‚Exciter‘ correspond exactly to the cut-off frequencies of the passband-curve.
Of course, the question arose whether the ‘Exciter’ can still be used, even for strongly coupled filters. The answer is easy:
- When measuring the resonance frequency of one half of the band-pass filter, the parallel capacitor has to be removed from the other half.
This was done for the Pathé filter and the ‘Exciter’ now showed unambiguous frequencies of 48 kcs and 49 kcs for the primary and secondary circuits, resp.
Just to confirm these values, the pass-band characteristic of the complete IF-amplifier of the Pathedyne SB was measured by injecting an AM-modulated RF signal into the mixer tube and recording the output voltage vs. frequency. The center frequency was found to be 48.6kcs, a value which is in good agreement with the band-pass resonance frequencies found with the ‚Exciter‘.
3.6 DUCRETET Supermodula à 5 lampes
Looking underneath the wooden chassis of a DUCRETET Supermodula à 5 lampes, one can see such filter units:

Characteristic features:
Housing: Ebonite, coils arbitrarily wound on wooden cores.
Type: Strongly coupled IF-transformers (k=0.25). Secondary tuned to a nominal resonance frequency of 55 kcs using parallel capacitors of ca. 275 pF (black blocks next to the coils, presumably MICA). The right hand transformer functions as the first IF-filter, the one on the left hand as the second.
It is interesting to note that in order to minimize inductive coupling, the IF-transformers were installed in such a way that their axes formed an angle of 90°. Optimum inductive decoupling would have been achieved, if the axes had formed an angle of 54.7°, the so-called Hazeltine-angle. It remains a secret why DUCRETET didn’t follow this prescription. Maybe the degree of decoupling achieved with the 90° tilt was found to be sufficient. Another reason could have been the attempt to avoid paying royalties for using Hazeltine’s patented coil arrangement.
All three IF-transformers of this DUCRETET radio were measured using the 'Exciter‘ and gave resonance frequencies of: 53.4 kcs, 58.3 kcs, and 57.8 kcs.
A measurement of the pass-band curve of the complete IF-amplifier gave a maximum at 54.3 kcs.
4 Results and Conlusions
While the simple resonance frequency measurements with the Exciter were carried out for all filter types described above, the later reported detailed frequency response measurements were made for filter types 3.1 - 3.5 only. No detailed tests were made of the DUCRETET filters (type 3.6), since this would have involved demounting them from the chassis – a step that collided with the interest of preserving the original state of the radio.
The following table summarizes the results obtained for the different types of filters. For easier understanding, the table has been subdivided into two sections, the first showing the results obtained for the IF transformers with tuned secondary, the second those obtained for band-pass-filters.
The last line of the table shows the results obtained for the low-pass π-filter INTEGRA <406>.
The columns of the table list the following parameters:
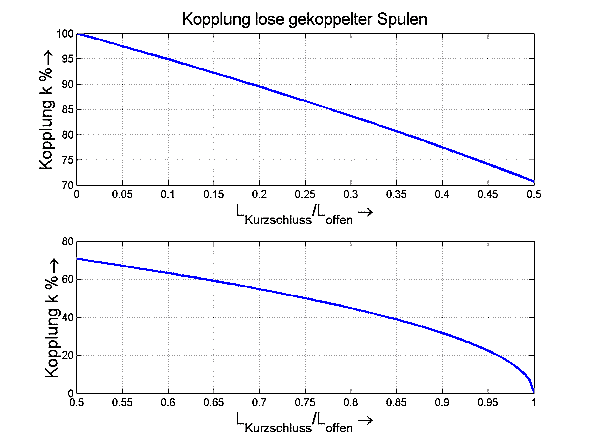
- Inductance of the primary and secondary coil. The coupling factor k between the two coils was determined by measuring their inductance with the opposing coil open (Lopen) and with the opposing coil shorted (Lshorted).
- For the INTEGRA low-pass π-filter the series inductance is stated.
- The value Cparallel of the capacitor used to tune the secondary circuit. The table does not show the nominal values of the capacitors but the values measured now in the course of the present investigations.
- The DC resistance of the primary and secondary coils.
- The resonance frequencies of the primary and secondary circuits measured using the EXCITER
- The theoretical resonance frequencies obtained from Thomson’s equation when putting in the measured values of Lopen and Cparallel
All inductance measurements were made using the classical Rohde & Schwarz L-Meter ‘LARU’, all capacitance measurements using R&S ‘KARU’.

- EXCITER measurements of the resonance frequencies of IF-filters that were used in French radio sets of the second half of the 1920s cover a range from 40 to 80kcs. It could so far not be clarified why French radio companies of this era used significantly different intermediate frequencies. Maybe just a trial and error strategy?
- Differences between the frequencies shown by the EXCITER and theoretical predictions are due mainly to intrinsic coil capacitances.
- The reader might wonder why, for the 'IF-transformers with tuned secondary‘ resonance frequencies were not only quoted for the tuned secondary but also for the primary. These values were actually found using the EXCITER. The quoted frequencies show the effect of the primary coils resonating with their intrinsic coil capacity. Using these values of the resonance frequency one can easily conclude on the coil capacity. While in the case of cheese-wound coils this parameter can be assumed to be of the order of 10 pF, it can attain values of up to 100 pF in the case of arbitrarily wound coils like those found in the Pathedyne SB! One should mention, that from the practical point of view this effect is irrelevant since the primary resonance is suppressed by the damping effect of the internal resistance of the tube to which the circuit is connected. Nevertheless it was considered interesting to see the order of magnitude of these intrinsic coil capacitances.
- It could not be clarified so far, why the primary resonance frequency in the DUCRETET SM5 filter is only 72kcs. Maybe the intrinsic coil capacitance is extremely high?
- In the case of the strongly coupled band-pass filter of the Pathedyne-SB receiver (k=0.43) the EXCITER showed no unique resonance frequency. The indicated value jumped stochastically between 41 und 65kcs. (Values given in parentheses). It was found later that these two 'jump‘- frequencies correspond to the edge frequencies of the passband-curve. (See part 2 of this report).
- In the case of the low-pass π-filter INTEGRA <406> the EXCITER was connected across the series inductor and indicated a resonance frequency of 14.2kcs, which is identical to the cut-off freqency of the filter.
Although the investigations reported here demonstrate that the EXCITER is an easy to build and useful instrument for the approximate determination of resonant circuit frequencies, one should bear in mind that in the case of coupled circuits, the result can be questionable. Additional measurements should be run to confirm the Exciter result. There are different alternatives to do this:
- By removing the capacitor from the second half of the band-pass filter (which in modern filters with their minute dimensions can prove a difficult task!). In the present case of the Pathedyne filters this could easily be done and the measurement yielded stable frequencies of 48kcs and 49kcs for the primary and secondary circuits (values in front of the parentheses).
- The classical approach of suppressing the influence of the coupled second circuit on the resonance behaviour is simple damping: This is usually done by putting a series connection of a capacitor of 4.7 – 10nF and a resistor of 10kΩ in parallel to the circuit whose influence on wants to suppress.
This damping approach is well known, since many radio service instruction manuals recommend it for re-tuning misadjusted RF and IF-filters.
- By recording the frequency response curve which requires more sophisticated test equipment that many collectors will not have available.
5 Outlook
As far as the practical setup of an EXCITER is concerned one could imagine using transistors with a higher transit frequency than the presently employed BF173, which would make this instrument more apt for the use with higher frequency circuits.
Alternatively one could imagine using an integrated circuit in place of the 3 transistors. A ‘Low Power Voltage Controlled Oscillator’ like the MC12148 could be suitable. Furthermore it is planned to combine the EXCITER with a PIC16F628A controller and a small low-cost frequency counter. All components could be combined to form one small unit, capable of measuring and indicating resonance frequencies of up to 50 Mcs.
To thank the Author because you find the post helpful or well done.
Frequency Characteristic of IF-Filters

The motivation for performing another series of measurements on IF filters/transformers found in french superheterodyen radios of the late 1920s originated in the fact that the resonance frequency indication obtained using an 'Exciter' were in some cases questionable.
Such dubious answers were obtained on two occasions:
(i) When trying to measure the resonance frequency of the primary coil of IF-Transformers. In the present context the term 'IF-transformer' will be used for an IF- filter in which only the secondary coil has a parallel capacitor to form a resonant circuit on the intermediate frequency, while the primary has no such capacitor. Examples are the GAMMA and SOLENO filters (see table in post #1)
(ii) When trying to measure the resonance frequencies of a strongly coupled band-pass filter, where both, primary and secondary coil have parallel capacitors, i.e. both sides of the filter are tuned to the IF. In the case of the PATHEDYNE IF-filter, the oscillation frequency of the Exciter jumped stochastically between two values.
In order to clarify these points, it was decided to run more precise measurements using a wobbulator (frequency sweep generator) and a spectrum analyzer. Two parameters were now measured for every filter type:
- The frequency dependant impedance Z(f) of filter primaries and secondaries, using a low capacity active probe (LCIS).
- The frequency response of the complete filter unit without load, and under realistic load conditions.
The Low Capacity Injector Sensor (LCIS)
The frequency dependant impedance Z(f) was recorded using an active probe, which in the following discussion will be called 'LCIS'. As shown in the following schematic, this self-built active probe combines a low capacity signal injector with a low capacity sensor and a JFET amplifier.
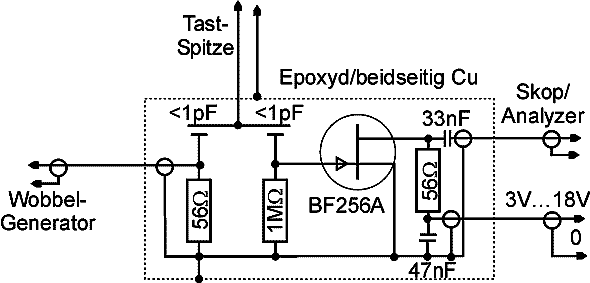
In order to minimize the influence of the output impedance of the signal generator (wobbulator) on the resonance behaviour of the DUT, its output signal was coupled into the DUT (in our case the resonance circuit) via a very small capacitor of <1pF. The RF-Signal building up acrosss the DUT is proportional to its impedance. It is sensed via another small capacitor, again < 1pF. The transistor acts as an impedance transformer allowing to record the output signal on an oscilloscope or on a spectrum analyser. Both, coupling and sensing capacitor were realized by neighbouring copper strips on the printed circuit board.
The dimensions of this active probe are so small, it can be accommodated in a copper water pipe of 15mm dia (yellow tube in the lower part of the picture). Signal connections use standard coax cables and BNC connectors. The JFET operating voltage of 3 - 18V DC is provided by a standard wall plug power supply.

Working with the LCIS is particularly comfortable if a spectrum analyzer with built-in signal generator is available. The measured curves can then be displayd on a logarithmic scale, leading to better resolution in the stop band of the filter.
Obviously, in place of our LCIS one can use any active probe for this type of measurement. The problem is that in the interest of minimizing the influence of the measurement equipment on the DUT, the coupling and sensing should be made through very small capacitors. Putting the probe in the vicinity of the DUT to achieve very loose coupling is a bad idea, since the reproducibilty of the measurements will be poor.
The "GAMMA" IF Transformer
As a first test specimen an IF- transformer made by the french enterprise "GAMMA" was analyzed. This type of IF-filter has an aperiodic primary consisting only of coil L1 (bottom) and a tuned secondary consisting of coil L2 (top) and a parallel MICA capacitor C = 225 pF.
When triodes are used for amplification, the smaller coil L1 is connected to the plate of the preceding tube, and the resonant circuit with the big coil L2 is connected to the grid circuit of the following tube.


Before commencing the frequency response measurements of the filter, the inductance and coupling factor of the primary and secondary coils were measured. This obviously required removing the 225 pF resonance capacitor from the secondary coil.
The test equipment used in this first stage of the investigations were:
- A capacity meter "LARU made by R&S" , and a digital resistance meter
- An "LCR-T5 Multifunction Tester" (values quoted in paranthesis)
The following inductance and resistance values were found: (the non-measured coil was always left open):
L1 = 9,35mH (9,1mH) R1 = 103,5 Ω (105,3 Ω)
L2 = 40,6mH (40,8mH) R2 = 250,2 Ω (254,8 Ω)
The results obtained from 'LARU', resistance meter and LCR-T5 show satisfactory agreement.
The coupling factor of the primary and secondary coil was derived by measuring the inductance of each coil in two conditions: (i) with the other coil left open, and (ii) with the other coil shorted. An in-depth description of this approach can be found in "Berechnungen in der Radiotechnik".
L1 = 7mH (7,1mH) with L2 shorted
L2 = 30,5mH (31,3mH) with L1 shorted
The values in paranthesis were obtained using the LCR-T5.
Using the curves found in the above quoted reference one can easily deduce a coupling factor of k = M/(L1L2)½ ≈ 50% , a value which can be considered sufficiently exact in the present context.
Frequency dependance of the "GAMMA" filter impedance Z(f)
Measurements of Z(f) using the LCIS
- LCIS connected to L1 (primary coil) L2 (secondary coil) left open, without circuit-C

The impedance curve Z(f) shows two peaks. Since the peak at 418.5 kHz has a higher amplitude, one would expect that the EXCITER will oscillate at this frequency. However, comparing this value with the result of the Exciter measurement given in the table of post #1 (467 kHz), one observes a very distinct difference. This indicates that inspite of the extremely loose capacitive coupling, the LCIS produces a higher capacitive load on the resonance circuit than the Exciter!
It seems worth mentioning that the measured Z(f) characteristic of L1 shows, that the load resistance seen by the triode is rather compex. This may serve as a hint that this type of amplifier stage might oscillate on unforeseen frequencies.
- LCIS connected to L1 with L2 shorted

In this constellation the Z(f) characteristic shows only one maximum. The position of this maximum corresponds to the lower maximum of the previous graph. As a consequnce of the shorted secondary coil L2 the inductance of L1 dropped to a lower value.
A second upper maximum is no longer observed. Obviously this occured due to coupling with the unloaded secondary coil.
- LCIS connected to L2 with L1 open (without C)

Only one resonance maximum ist observed. The resonance frequency is determined by L2 and stray capacitances.
- LCIS connected to L2 with L1 shorted (without C)
Shorting coil L1 reduces the inductance of coil L2 which results in a higher resonance frequency.
Apart from that, no significant influence of coil L1 on the impedance characteristic of L2 is seen. This is in contrast to the opposite case shown in the first two graphs above, where the LCIS had been connected to L1 and the change of L2 from open to shorted had a very dramatic impact on the Z(f) curve of L1.
- LCIS connected to L1 , L2 with resonance-C=225 pF
The impedance characteristic of L1 is now very similar to the one with coil L2 shorted.
The characteristic has no second maximum. The response curve resembles the case "LCIS connected to L1 with L2 shorted (without C)"
- LCIS connected to L2 with L1 open, again with resonance-C=225 pF parallel to L2
The Spectrum Analyzer settings were identical to the previous cases. At first glance only noise is measured. However, on the far left side a somewhat higher peak may be identified. Accident?
To clarify this point, the area around the assumed peak was magnified by reducing the displayed frequency range from the previously used 30 - 600 kHz to 40 - 100 kHz, and by increasing the output signal level of the RF generator.

Now the resonance of the filter secondary circuit L2-C is clearly seen at 50.050 kHz. So the vague peak in the previous measurement was not accidental but a realistic signal, camouflaged by the background noise!
Additional Tests without LCIS
Some additional tests were run on the GAMMA filter to quantify the effect of tighter coupling of the signal generator and spectrum analyser to the circuit. In these tests the RF signal generator was injected into the hot end of the secondary circuit L2-C via a capacitor of 12 pF, and the spectrum analyser was connected to the same point via its standard probe in series with a capacitor of 2.7 pF. (The LCIS used coupling capacitors of <1pF)

One observes a weak resonance peak at 50.8 kHz (marker).
One observes that, compared to the previous graph which was recorded using the LCIS, the measured characteristic is rather noisy, but what is more important: None of the two curves shows the typical resonance characteristic of an LC resonant circuit. The reason for this is the capacitive couping of the RF signal generator and the probe to the hot end of the LC resonant circuit which prefer higher frequencies. This leads to a significant distortion of the typical LC resonant curve.

The typical LC resonant curve will be obtained if the RF signal generator is coupled to the foot of the resonant circuit. Therefore, a fooder C = 66 nF was installed in series with the circuit resonance capacitor of 225 pF. Injection of the RF is parallel to the fooder C.
The spectrum analyzer stays connected to the hot end of the circuit, again using a 10:1 probe in series with 2.7 pF.
As one can see, that foot point signal injection produces a proper resonance curve.
Measurement of the frequency response curve
While all measurements described above had the objective of showing the frequency dependant impedance of the IF filter primary and secondary circuit, the following investigations were made to show the frequency response of the complete filter unit under realistic load conditions in a radio set.
For this purpose the output of the RF signal generator (Ri=50 Ω) was now connected to the hot end of L1 via a resistor of 33 kΩ, representing a realistic simulation of the internal resistance of the tube feeding the filter.
The spectrum analyzer (Ri=1 MΩ) was connected to the hot end of the secondary resonant circuit (L2 & C =225pF) via its 10:1 probe with an additional series capacitor of 2.7 pF. This means that the secondary also saw a load comparable to the control grid input of the following tube.

We can now see that operated under realistic load conditions, with signal injection into L1 and signal pick-up at L2, the GAMMA filter shows a clear filter behaviour.
In retrospect one might ask oneself why we did all the measurements described above, if a realistic measurement would have given the correct answer straight away.
The answer to this question is found in the first part of this report. Using the EXCITER as a simple gadget to find resonance frequencies of LC-circuits, we had found some questionable results, like e.g. the surprisingly high resonance frequency of the GAMMA filter primary. Only the detailed measurements of the frequency dependant impedance of the filter primary and secondary circuit allowed understanding the sometimes unexpected results obtained from EXCITER. The origin of such strange results can be in primary coil oscillations with its own intrinsic capacity or in primary-secondary-interaction.
The problems encountered here in the context of the EXCITER measurements may also be found in modern semiconductor circuits. The difficulty results from a loose coupling of the coils of a RF transformer. A practical example is the oscillator in a transistor set. An oscillator is de facto comparable to an Exciter: both have the task of stimulating a passive LC circuit to oscillate.
Since the necessary coupling coils have minute coupling factors, a jump of the oscillator frequency to a higher value may happen easily - for example a minor change in the supply voltage can be sufficient to trigger this jump. And then the frequency will be independent from the tunig of the circuit. Oscillators always choose this frequency where they will have "optimal conditions". Radio design engineers have to find clever circuit solutions to avoid such problems.
The "SOLENO" IF Transformer
Like the "GAMMA" IF-transformer described above, the "SOLENO" IF-transformer has an aperiodic primary coil and a secondary coil tuned to the IF frequency using a parallel capacitor. While in the "GAMMA" transformer, the secondary circuit used a MICA capacitor of 225pF to tune the IF to a fixed value of ≈ 50 kHz, the "SOLENO" has a built-in variable capacitor that allows tuning the IF between 41 and 77 kHz.


Measurements of Z(f) using the LCIS
- LCIS connected to L1 (primary coil) with L2 (secondary coil) left open, without circuit-C

Measurement of the primary coil shows (comparable to Gamma) a maximum far above the nominal IF frequncy. However, the coupling between primary and secondary coils is tighter than the Gamma transformer, and therefore a second maximum (59.5 kHz) shows up.
The Exciter indeed oscillates with the frequency of the absolute maximum, cnf. table in post #1.
- LCIS connected to L2 with L1 left open

Here again a circuit resonance curve shows up. The circuit is capacitively coupled to it's "hot" end.
Measurement of the frequency response curve
Again the measurement of the frequency response curve used a source resistance of 33 kΩ for the injection from the RF generator. From the hot end of the secondary resonance circuit a 10:1 probe with 2.7 pF in series picked up the the signal for the spectrum analyzer.

Compared to the frequency response curve of the GAMMA, the SOLENO has a lower Q-factor, and is consequently less selective. This is a consequence of the fact that the GAMMA coils were cheese-wound, whereas the SOLEMA coils were wound arbitrarily.
The "INTEGRA <412>" IF Bandpass Filter
This INTEGRA type <412> is a "genuine" bandpass filter. It has tuned primary and secondary circuits.


Measurements of Z(f) using the LCIS
- LCIS connected to L1 with L2 left open

Although both coils are "far" from each other, the coupling between them is sufficiently strong to produce over critical coupling, which results in the appearance of two maxima in the frequency response curve.
- LCIS connected to L2 with L1 left open

Here again two maxima show up. Now the secondary maximum is higher.
- LCIS conected to L2 with L1 bridged with 33 kΩ (simulating the preceding tube's internal resistance)

It can be seen that the tube's (simulated) internal resistance now attenuates the primary circuit to such an extent that the second maximum disappears.
Judging from todays knowledge, this is not the optimal design for a bandpass filter.
Measurement of the frequency response curve
Like in the previously tested filters GAMMA and SOLENO, the measurement of the frequency response curve was run with a source resistance of 33 kΩ, and the probe connected to the hot end of the secondary circuit via an additional series capacitance of 2.7 pF.
As one might have expected, the frequency response curve differs only marginally from the previous measurement using the LCIS.
The "INTEGRA <406>" Lowpass π-Filter


Normally, a regenerative detector is followed by a lowpass filter (of RC or LC type) for blocking RF signals. In this set, however, the lowpass filter has a π structure.
Networks with a π structure are usually found in impedance matching units between a transmitter and an antenna. In regenerative receivers, however, such a structure is very rarely found.
For optimum performance such a lowpass π - filter has to be terminated on both sides with its characteristic resistance, which in the case of the INTEGRA <406> amounts to approx 2.8 kΩ only (see comments in post#1 of this thread). This value is far too low for the application in the LAGIER ZZ radio set. Therefore one has to assume that this π structure was not installed as a genuine AF-lowpass filter but for RF blocking only.

Using again a source resistance of 33 kΩ, and the output only loaded with the probe, a resonance maximum at approx. 14.1 kHz is found. This result is in good agreement with the value found with the EXCITER.
The frequency response curve also shows that the INTEGRA <406> π filter is not a lowpass as expected from its topology.

Using alternatively a source resistance of 8 kΩ (corresponding to the internal resistance of an REN904), and also a load resistance of 8 kΩ, one observes an increase towards higher frequencies.
This would allow compensating to some extent the drop of the AF-amplitude towards higher frequencies caused by the narrow bandwidth of the IF filters in the preceding stages. Maybe this was the original purpose of introducing the INTEGRA <406> π filter between the regenerative stage and the AF amplifier. Up to now this point could not be finally clarified.
The Pathedyne IF Filter
.jpg)
The IF filters used in the Pathedyne SB receiver are bandpass filters. Primary and secondary coil have parallel capacitors of nominally 250 pF and 350 pF (measured values: 215 pF and 290 pF), which tune the circuits to approx. 50 kHz.
The mechanical setup is surprisingly simple: Two arbitrarily wound coils on cardboard bodies with very little space between them. Therefore, the coupling factor k becomes much too large for a "genuine" IF bandpass filter, and an over critical coupling will result. It can be expected that the frequency response curve will show two maxima.
Measurements of Z(f) using the LCIS
- LCIS connected to L1. Both, L1 and L2 have their original capacitors in parallel.
.jpg)
The LCIS measurement at the primary circuit shows two distinct maxima.
- LCIS connected to L2 Both, L1 and L2 have their original capacitors in parallel.

The LCIS measurement at the secondary circuit shows the same peaks, however, with a slightly lower amplitude, and at somewhat shifted frequencies.
Measurement of the frequency response curve
In a first measurement campaign, the original circuit capacitors were used. As already mentioned above their capacitance values had dropped from the nominal value of 250 pF to 215 pF and from 350 pF to 290 pF, respectively.
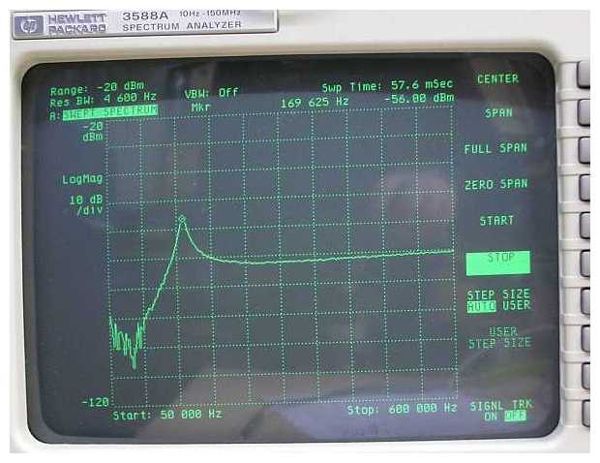
- Signal injection into primary using a source resistance of 82 kΩ

The IF filter is over critically coupled. Both peaks are clearly visible.
The maximum at 65.25 kHz is higher and belongs to the secondary circuit which is unloaded.
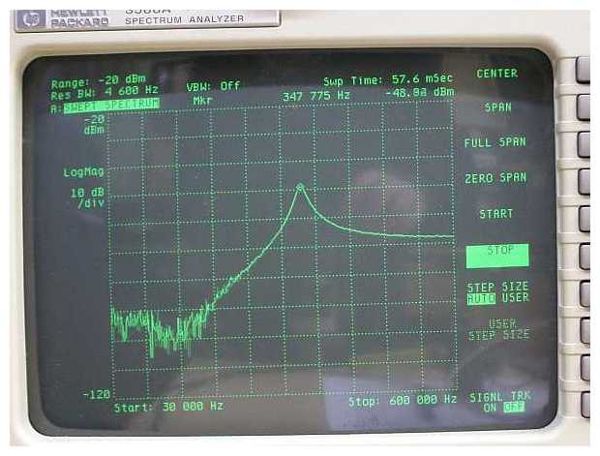
- Signal injection into secondary using a source resistance of 82 kΩ

The maximum at 41.75 kHz belongs to the unloaded primary circuit.
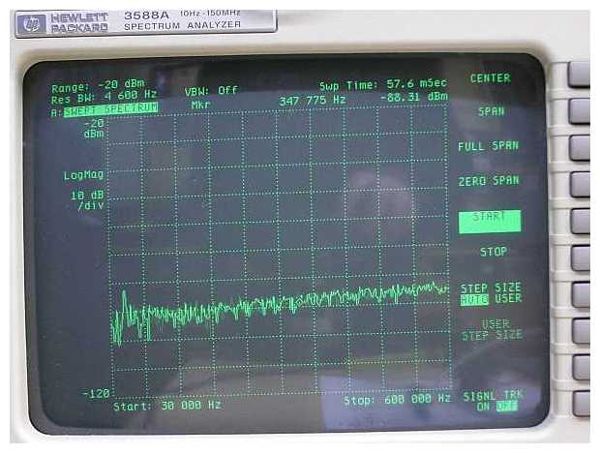
- Signal injection into primary using a reduced source resistance of 22 kΩ

A source resistance of 22 kΩ corresponds to the internal resistance of a triode feeding the bandfilter.
As a consequence of the lower source resistance the primary circuit is now damped to such an extent that the second peak disappears. The over critical coupling is no longer observed.
- Signal injection into secondary using a reduced source resistance of 22 kΩ

When injecting the signal into the secondary circuit (reverse signal injection), the 22 kΩ damping causes the impression as if one had a well dimensioned bandpass filter with a flat top frequency response curve.
In a second measurement campaign, the original capacitors were removed from the filter body and replaced by high quality ceramic capacitors of 240 and 350 pF. Before mountig these new capacitors they were checked on the C- meter 'KARU'. 'KARU' is a resonance capacitance meter, with a panel instrument giving an indication of the oscillation amplitude. It was surprising to see that new ceramic capacitors produced a much higher oscillation amplitude than the old capacitors, indicating that the latter had not only lost part of their capacity but also that their quality was poor. After replacement of the filter capacitors, the 4 preceding measurements (2 with 82kΩ source resistance and 2 with 22 kΩ source resistance) were repeated to see whether there was any visible difference in the resonance curves.
- Signal injection into primary using a source resistance of 82 kΩ

As a consequence of the higher values of the new capacitors, the resonance peak of the secondary circuit dropped from 62.25 kHz to 59 kHz.
The resonance curves are steeper than with the old capacitors.
- Signal injection into secondary using a source resistance of 82 kΩ

The replacemant of the capacitors shifted the resonance peak of the primary from 41.75 kHz to 38 kHz. Here also the resonance curve is steeper.
- Signal injection into primary using a reduced source resistance of 22 kΩ

Loading the IF filter with the simuated internal resistance of the triode only one peak is observed at 52.75 kHz. (With the old capacitors the peak was at 60.25 kHz).
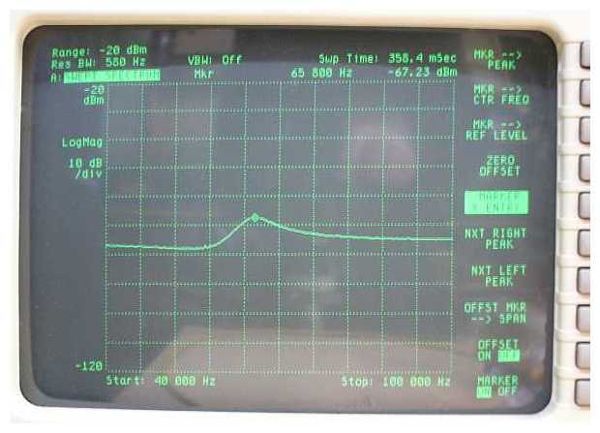
- Signal injection into secondary using a reduced source resistance of 22 kΩ
.jpg)
In the case of reverse singnal injection, a clear resonance peak appears. This may be due to the higher Q-values of the ceramic capacitors.
Summarizing the results obtained for the PATHEDYNE IF - filter one can say that with sufficient damping the two pronounced humps disappear, and the more or less flat top of the frequency response curves shows a certain similarity with a bandpass filter. One should keep in mind however, that a 'proper' bandpass filter in modern understanding does not only have a flat top but steep slopes on both sides, and this is most definitely not the case with the PATHEDYNE filter. Well, one should not forget that these radio sets were built during the childhood of superheterodyne radio technology and that enginineers were still learning.
We have also seen that, without sufficient damping the frequency response curve of the PATHEDYNE IF filter shows two pronounced peaks. This explains the surprising results obtained when measuring the resonance frequency of these filters using the EXCITER. The EXCITER stimulates the filter circuits without putting any significant load on them. At which of the 2 peak frequencies 41kHz or 65 kHz oscillations were stimulated appeared to be purely random. By the way: This frequency jump never occured once the EXCITER had started the oscillations. But switching it off and on again, it proved to be completely unpredictable, which of the two results one would get.
The 'jump' phenomenon typically occurs when over-critically coupled resonant circuits form part of an oscillator - like is the case with the EXCITER. In vintage single stage AM transmitters the jump phenomenon posed a serious a problem. Rukop has investigated this phenomenon and published his results here: "Reiß-Diagramm" (rip-diagrams).
To thank the Author because you find the post helpful or well done.