Frequency Comparisons Using Roulette Patterns
Frequency Comparisons Using Roulette Patterns
Source: Tektronix Service Scope No 26 June 1964
FREQUENCY COMPARISONS USING ROULETTE PATTERNS
Roulette Patterns, because they retain their shape under conditions of slight oscillator frequency drift, offer a considerable advantage over the use of Lissajous figures in making frequency comparisons.

Type 564 Storage Oscilloscope with two Type 3A3 Dual-Trace Differential Plug-In Units, one in the vertical and one in the horizontal amplifier compartments.
High-ratio frequency comparisons by use of Lissajous figures are often difficult to observe. Any slight oscillator frequency drift causes the Lissajous figure to change shape. The display appears to rotate in a plane perpendicular to the face of the cathode-ray tube. Since the front and back portions of the figure are not separated, interpretation of the pattern becomes increasingly difficult as the frequency ratio increases.
Roulettes are much easier to interpret than are Lissajous figures because slight oscillator frequency drifts cause a pattern rotation in the plane of the crt screen without a change in pattern shape. Roulettes are readily displayed with oscilloscopes havingdifferential inputs on both the horizontal and vertical amplifiers.
Several Tektronix Oscilloscopes and Oscilloscope/Plug-In combinations lend themselves to this application. The reference chart which appears elsewhere in this article lists these oscilloscopes and oscilloscope/plugin combinations. It also gives their sensitivity and bandpass capabilities.
The waveforms illustrating this article were photographed using a Type 564 Storage Oscilloscope with two Type 3A3 Dual-Trace, Differential Plug-In Units—one in the vertical and one in the horizontal plug-in compartments. The storage feature of the Type 564 Oscilloscope makes this instrument the ideal choice for this application. As mentioned before, a slight drift in oscillator frequency will cause a rotation of the displayed roulette pattern. The rotation will be in the plane of the crt. The operator, by employing the Storage mode of Display, can "stop" this rotation for ease in counting the points of the roulette pattern. This count, which will he explained later, is a necessary part of the application procedure.
As for the other oscilloscope and oscilloscope/plug-in combinations listed on the
reference chart, the best way to "stop" the roulette-pattern rotation on these instruments is to use an oscilloscope camera and photograph the display.
"Stopping" the roulette pattern's rotation is not, however, a necessary part of the application. One can usually control the drift in oscillator frequency to a point where the roulette pattern remains stable enough for an accurate point count.
How to set up roulette patterns

Fig. 1. Circuitry For Displaying Roulette Patterns.
Fig. 1 shows the circuit used in displaying roulette patterns. Transformers T, and T: provide isolation so that both of the signal sources can be operated with a common ground connection. In many applications either one or both of the transformers can be omitted, provided hum problems are not encountered. If isolation transformers are not used, the signal sources should be operated without a common ground connection. For convenience, we will discuss the display of roulette patterns at audio frequencies. You can use any signal source within the frequency range of your oscilloscope, however, stable radio-frequency displays are usually limited to crystal-controlled frequency sources. The circuit adjustment procedure is as follows:
- Turn on the equipment and allow a few minutes for warm-up.
- Using appropriate settings, adjust the plug-in units' V/CM controls to provide equal sensitivities for both the VERTICAL and HORIZONTAL channels. Should later readjustment be necessary, keep the sensitivities equal.
- Set the output amplitude of both frequency sources to zero.
- Advance the amplitude control on the higher-frequency generator until an elliptical trace appears on the crt screen. Adjust R, and C, until the ellipse becomes a circular shape. Return the output amplitude of the higher-frequency generator to zero.
- Advance the amplitude control on the lower-frequency generator until an elliptical trace appears on the crt screen. Adjust R, and C, until the ellipse becomes a circular shape.
- Readvance the amplitude control on the higher-frequency oscillator to obtain the desired roulette. Adjust the frequency of either oscillator for a stationary pattern. Typical patterns for a 15:2 frequency ratio are shows in Fig. 2. The patterns differ only in that the output amplitude of the higher-frequency generator is greater in Fig. 2b.
To determine the frequency ratio, count the total number of points on the circumference of the pattern (17 points in Fig. 2a). Call this number N1. Next, determine the number of points passed over in tracing from one point to another along the figure. For instance, in tracing from point 1 to point 3 in Fig. 2a, only one point (point 2) is crossed.
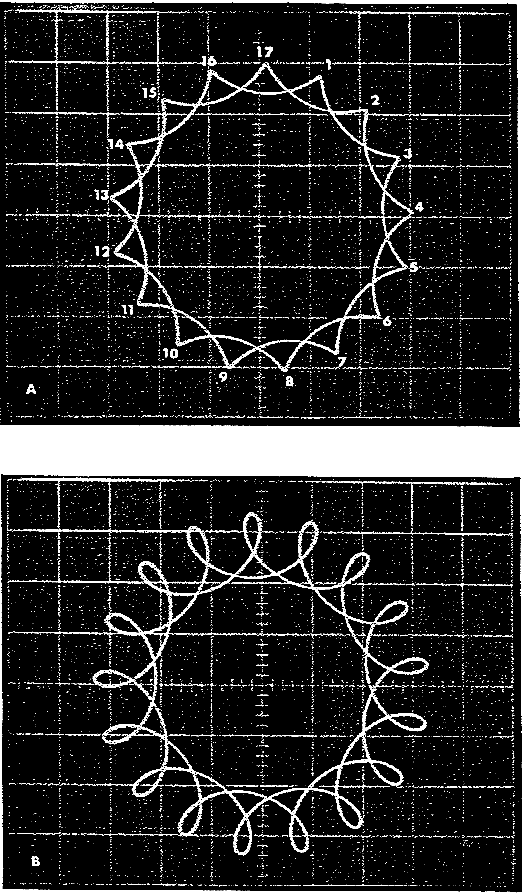
Fig. 2. Typical roulettes for a 15:2 frequency ratio
Add one to this number and call it N2. The ratio of the two frequencies is given by:
f2 N1 – N2 (17-2)
-- = ---------- = -------- = 15:2 for Fig. 2a.
f1 N2 2
When no points are crossed in moving from one point to another along the trace, the ratio of frequencies is a whole number (an integer), and the ratio is simply one less than the total number of points on the pattern circumference. Fig. 3 shows a 21 point pattern indicating a 20:1 frequency ratio.
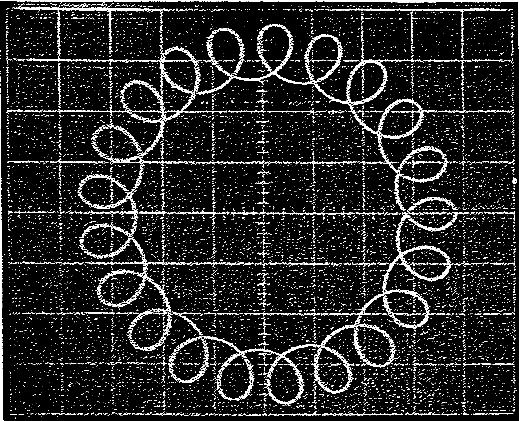
Fig. 3. Roulette pattern for a frequency ratio of 20:1
Theory
The operation of the circuit of Fig. 1 is best understood by the application of superposition theory. We first determine the crt trace deflections produced by the signal sources operating separately, then we add the resultant deflections vectorially. Fig. 4a shows the circuit of Fig. 1 redrawn and slightly revised. Here, we have replaced the

LISSAJOUS PHASE-MEASUREMENT GRATICULE
The 8 x 8 cm phase-measurement graticule (Tektronix part number 331-057), originally designed for use with the Type 536 X-Y Oscilloscope, will work equally well with the Type 661 Sampling Oscilloscope and the Type 504 X-Y Oscilloscope. This special graticule (see Figure 1) is useful in measuring phase differences from lissajous displays.
Attachments:- Schema (39 KB)
To thank the Author because you find the post helpful or well done.