DF97 Pentode and Tetrode curves
DF97 Pentode and Tetrode curves

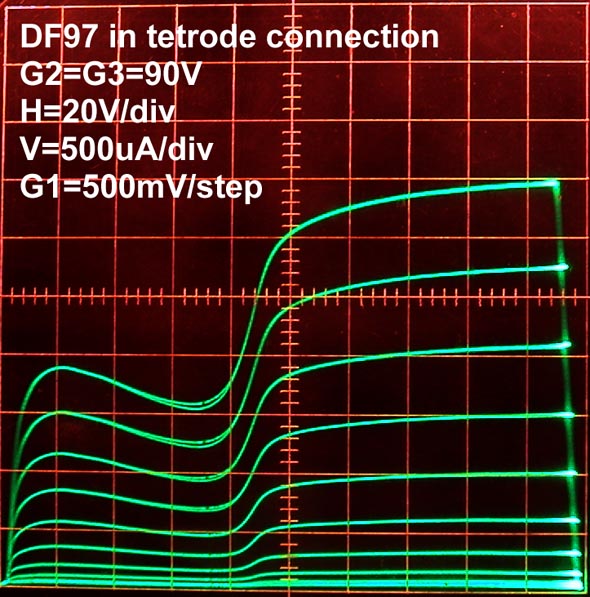
The following plots show the DF97 pentode wired as a tetrode in two different configurations. The plots can be seen at a higher resolution with right-click and "view" or "save".
The tetrode kink always starts when the plate voltage drops below the screen voltage.
The smaller diameter of the DF97 plate allows for more secondary emission electrons to be collected by the screen grid, in particular when the tetrode connection has G2 and G3 wired together, as the tetrode screen. This produces the very sharp tetrode kink when the plate voltage drops below the 90V at the screen.
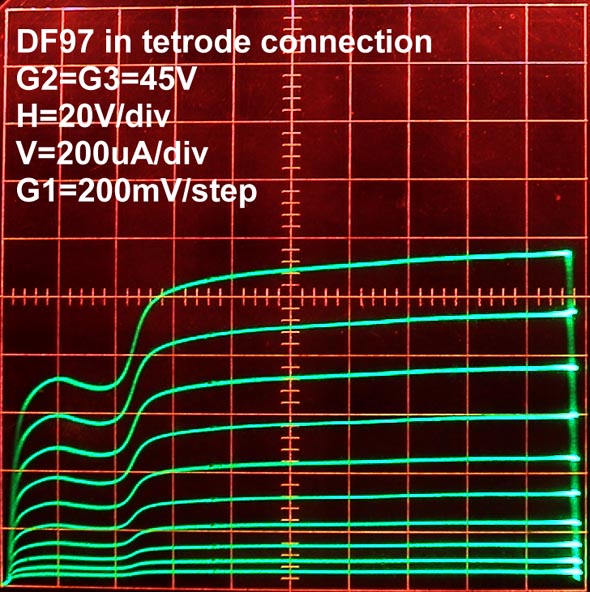
Reducing screen voltage to 45V reduces plate current, and softens the tetrode kink because electrons hit the plate with less velocity thus producing a smaller proportion of secondary emission.
When G3 is tied to the plate, many more secondary emission electrons from the plate, are collected by G3, producing a much softer tetrode kink when the plate voltage drops below the screen. In this set of curves with 90V at the screen, the secondary emission current appears to perfectly cancel current increase that a higher plate voltage cause. The horizontal section between 20V and 60V is a region of extremelly high impedance, making it possible to achive very high Q and gain in a resonant LC load.
The flat region of the tetroke kink has the highest voltage gain of the entire curve. The plate impedance with 150V at the plate, 90V at the screen and 0V at the control grid, is around 300kOhms. The impedance of the plate on the same curve at 50V is easily 10 times higher. The 1mS transconductance seen between the two adjacent curves with G1=0V and G2=-0.5V combines with the very high plate impedance for a plate voltage gain in excess of 3000. The plate impedance between 20V and 60V can be fairly approximated with a current source.


In this configuration, with G3 tied to the plate, a reduction of screen voltage drops the current and moves to the kink to the left, as expected, but without a significant change in the tetrode kink.
The first of the following three plots is the familiar Pentode curve family. The second plot shows the substantial increase in plate impedance (more horizontal) with the application of a small +7.4V bias at the suppressor grid.
The plate resistance at 90V in the Pentode configuration, with G1=0V, is 200kOhms as shown by the slope at the center of the the top curve on the first plot, while it is 600kOhms when the 7.4V suppressor grid bias is applied in the second plot.
The resonant impedance of 450kHz-470kHz IF transformers that I measured recently was right in this range. I measured some IF transformers with just over 200kOhms and some nearly 600kOhms. So a higher IF stage gain and selectivity could be expected from applying 7.4V to the suppressor grid.
The third plot shows tetrode operation with G2 and G3 at 90V.


The following plots superimpose pentode operation with G3 bias and Tetrode operation.


The effect of the small +7.4V bias at the suppressor grid was particularly interesting, considering that much of the effort in pentode and beam tetrode design during the tube era concentrated around the low plate voltage operation region; remember the KT-"kinkless tetrode" English line of tubes, with the KT88 being one of the most famous?
These plots were extracted from a thread where the DF97 was considered as a substitute for a 1920's filamentary tetrode.
Regards
-Joe
To thank the Author because you find the post helpful or well done.