hp Distortion Measuring Equipment
hp Distortion Measuring Equipment
JOURNAL Vol 2 No. 12 Copyright 1951 HEWLETT – PACKARD CO.
-hp- Distortion Measuring Equipment
Brunton Bauer
The simple, straightforward measurement of harmonic distortion has always been valuable in design, test, and production work. This basic measurement undoubtedly gives as much if not more information about the operation of an amplifier as any other single measurement that can be made. In spite of the development of more complex methods and equipment for measuring various effects of non-linear transfer characteristics, harmonic distortion measurement, because of its ease and simplicity, is still the predominant method in use; and the demand for equipment for such measurements is greater than it has ever been. In electronic equipment, where the transfer characteristic of devices such as amplifiers is relatively constant over the frequency range of interest, measurements of harmonic distortion have a logical engineering basis, since the results of these measurements1 can be related to those given by other methods.

Figure 1- -hp- Model 330 Distortion Meter
The measurement of harmonic distortion is based on the definition % distortion =

being the amplitude of the fundamental, A2 the second harmonic, etc. Two methods for measuring distortion have evolved from this definition. In one method, the amplitude of each frequency component appearing in the output of a device fed with a single pure frequency is measured with a special frequency- selective voltmeter or wave analyzer. The measured values are then substituted in the above expression. In the second method, the amplitude of a voltage containing harmonics is first measured; then the fundamental is filtered out and the rms value of the combined harmonics is measured. The ratio of the two values, expressed in per cent, is the distortion. This second method has come to be known as the "total" distortion-measuring method. -hp- instruments for measuring distortion include both the frequency-selective voltmeter type of instrument as well as several different instruments of the "total" distortion- measuring type. These vary from the complete distortion meter to simple filter attenuator sets.
DISTORTION METERS
The usual test set-up necessary for measuring harmonic distortion consists of an arrangement where by a source of pure sinusoidal voltage feeds the device under test, while the output of the device is applied to the distortion meter.

Figure 2. Recommended set-up for distortion measurements. Use of oscilloscope assists in identifying harmonics, detecting oscillations, etc. Oscilloscope sweep is obtained from signal source.
However, such an arrangement ignores the output terminals that are provided on modern distortion meters. These terminals are one of the most useful features of the modern distortion meter and are provided so that the distortion meter can be used with an oscilloscope. The distortion meter-oscilloscope combination provides considerably more information about the device being tested than does a simple expression of the magnitude of the distortion. For example, transient oscillations caused by saturation of iron in the circuit or continuous oscillations caused by an unfavorable gain-phase shift characteristic can be readily detected with the distortion meter - oscilloscope combination. Such conditions not infrequently occur at a low level and are difficult to detect under ordinary circumstances. Other information that can be obtained using this combination includes the nature of the distortion, distortion caused by the presence of grid current on driving peaks, presence of excessive noise and hum, etc. (Figures 3 and 4.)
The modern distortion meter is a highly flexible audio measuring instrument. A block diagram of the -hp- Model 330B Distortion Analyzer is shown in Figure 5. The instrument consists of three basic circuits, any of which can be used separately. The voltage to be analyzed is applied to a wide-band stabilized amplifier that gives the instrument a sensitivity such that an input of 1 volt can be analyzed for distortions as low as 0.1%. A 20 cps -20 kc tunable filter capable of eliminating the fundamental by more than 60 db is included as part of the amplifier. The amplifier is arranged so that the filter can be switched out of the circuit if desired. The output of the amplifier is connected to a precision audio voltmeter having high sensitivity and a wide frequency range. In operation, the voltage to be analyzed is connected to the input of the amplifier and the gain of the amplifier is adjusted for an output of 10 volts (the amplifier overload point) as read on the meter. The filter is then switched in and tuned to eliminate the fundamental, leaving the residual voltages in the input wave to be read on the voltmeter.
The voltmeter controls are conveniently arranged so that the distortion ratio of the two voltmeter readings can be read directly in percentage or in db.

(a) (b)
linear sweep sinusoidal sweep
Figure 3. Oscillograms illustrating type of information obtainable with distortion meter-oscilloscope combination, (a) shows a sine wave with approximately 1.5% distortion, (b) shows oscilloscope presentation obtained while measuring the distortion. This presentation displays the actual distortion components, consisting mainly of second harmonic but which also include a transient oscillation. Such oscillations, often undetected unless an oscilloscope is used during measurement, indicate an unstable system and are often themselves unstable, varying with driving level, frequency, etc.

Figure 4. Oscilloscope presentation obtained (a) while measuring distortion in amplifier where distortion level is of same order of magnitude as hum, and (b) while measuring distortion in amplifier driven at point of overload. Notch in pattern is caused by small grid current and will increase sharply with small increase in drive.

Figure 5. Block diagram of circuit of -hp- Model 330B Distortion Analyzer.
In the design of the instrument, considerable care is taken to avoid introduction of distortion by the instrument itself and to assure inclusion of high-order harmonics in the voltmeter readings. The input amplifier is designed to introduce less than 0.1% distortion and to have a constant gain over a bandwidth from 20 cps to more than 100 kc. Similarly, the voltmeter response is made constant from 20 cps to more than 100 kc. The most sensitive range of the voltmeter is 30 millivolts full scale which permits readings of distortions as low as 0.1% at | scale. The tunable filter (Figure 5) used in the Model 330B is an interesting adaptation of a Wien bridge. The complete filter includes an input and output amplifier as well as the bridge itself. In operation, the bridge is tuned for rejection of the fundamental frequency, and the harmonic frequencies are passed on to the following amplifier. However, the transmission characteristic of the bridge for harmonic voltages is not constant. Typically, the second harmonic will be attenuated several db more than the third, the third more than the fourth, etc. To correct this characteristic, a negative feedback loop is connected around the bridge to give the filter an overall characteristic such that the second harmonic is attenuated less than 1 db. The tunable filter is designed to cover a continuous frequency range of 10:1. This range is extended to 1000: 1 by a switch that changes the bridge constants in three decade steps, providing overall tuning from 20 cps to 20 kc.
The voltmeter section of the distortion meter is arranged so that it can be used separately as a laboratory-quality voltmeter. For this purpose a separate set of terminals is provided on the front of the distortion meter. The voltmeter output terminals described earlier are connected across the metering circuit and are designed to be connected only to high-impedance devices such as oscilloscopes. Hence, voltmeter readings should not be taken if a low-impedance load is connected across the voltmeter.
One of the measurements for which the distortion meter is useful is the measurement of noise in audio - equipment. In order to make the instrument capable of such measurements, a control is provided that increases the gain of the input amplifier section from 20 db to 40 db. This arrangement allows noise voltages as low as 100 microvolts to be read, although the frequency range of the input amplifier is reduced to approximately 20 kc.
RF USAGE
One of the important uses of a distortion meter is measuring the distortion in modulated carriers of am broadcast stations. For this use, the distortion meter must be operated in combination with an am detector having low distortion. One of the -hp- distortion meters, the Model 330D, is provided with such a detector that is tunable to any rf carrier lying between 550 kc and 60 mc. The Model 330D is designed to be coupled loosely to the final tank circuit of an am transmitter so that distortion measurements can be made directly.

Figure 6. -hp- Model 320B Distortion Analyzer
The -hp- Model 330D, as well as being provided with an am detector, is also provided with an indicating meter having ballistic characteristics conforming to FCC requirements. Since the Model 330D is in-tended primarily for broadcast station use where the carrier frequency of the station can be at frequencies where the distortion meter's volt meter will have a response, the high- frequency response of the instrument is purposely reduced to minimize erroneous readings due to pick-up of the station's carrier frequency. When an am detector is provided as part of the station equipment, the -hp- Model 330C distortion meter can be used. This instrument is provided with an indicating meter having ballistic characteristics conforming to FCC requirements and is similar to the Model 330D, except that the a-m detector circuit is omitted.
OTHER INSTRUMENTS
For some production applications, it is necessary to make distortion measurements at only a few preset frequencies. Such measurements can be made with the aid of a simple filter-attenuator set like that shown in Figure 6. This set is not a complete distortion-measuring device in itself, but requires the use of a sensitive external voltmeter.

Figure 7. Block diagram of circuit of -hp- Model 320 Distortion Analyzer.
A block diagram of the set appears in Figure 7. In operation, the filter switch is set for the desired frequency and the signal source tuned until a null occurs. A balance control is provided on the set to assist in obtaining the null. After the null has been obtained and a reading taken on the detector, the switch is set so that the attenuators replace the filter in the circuit. The attenuators are then adjusted so that the same reading is obtained on the detector as when the null was obtained.
The reading of the attenuators then gives the value of the distortion level in decibels below the signal level. The filters in the set have a rejection characteristic of at least 60 db, while the attenuators have a combined range of 70 db so that distortions as low as 0.1% can be read.

Figure 8. Circuit of bridged-T filter.
Two models of the set are available. One is designed for making measurements at two frequencies, 400 and 1000 cps. The second set is designed for making measurements at six frequencies, 50, 100, 400, 1000, 5000, and 7500 cps. Sets for other frequencies can be provided.
HIGHER FREQUENCIES
Occasionally in laboratory and production work a requirement arises where it is necessary to measure distortion at frequencies higher than the range for which commercial distortion meters are available. A simple circuit that can be easily constructed for such measurements is the bridged-T filter shown in Figure 8.
Theoretically, for a balance to occur in the filter, R should have a value equal to Q1 X¼. In a practical circuit, this will require that R be in the form of a variable resistance. The values of L and C are selected so that the circuit will be parallel resonant at the desired frequency.

Figure 9. -hp- Model 300A Harmonic Wave Analyzer.
The input impedance of the filter at the fundamental frequency is 2R, approaching R at higher frequencies. While it is desirable that the impedance of the filter be high compared to the output impedance of the source being measured, practical considerations will limit the impedance to the order of 20,000 ohms. The main limitation is brought about by stray capacity which disturbs the voltage phases in the filter so that a high order of rejection cannot be obtained.
In practice, it is desirable to restrict the Q of the coil to values lying between approximately 6 and 12. Values above 12 will cause the filter to be difficult to tune, while values below 6 will result in undue attenuation of the second harmonic.
Figure 10. Block diagram of circuit of -hp- Model 300A Harmonic Wave Analyzer.
THE WAVE ANALYZER
Although the distortion meter is a fast and convenient method for measuring distortion, there are applications where measurements of the individual components of distortion are required. These applications include the analysis of vibration and noise components, analysis of complex waves, hum measurements, etc.
Such measurements are made with a special frequency-selective volt meter or harmonic wave analyzer. The circuit of this instrument is indicated in Figure 10. The voltage to be analyzed is applied to an input phase inverter which feeds into a balanced modulator where mixing with the local oscillator occurs. As a result of the balanced operation, the local oscillator frequency component is suppressed in the output of the modulator, leaving only the side bands. Following the modulator is a highly-selective amplifier which accepts only the lower sideband.
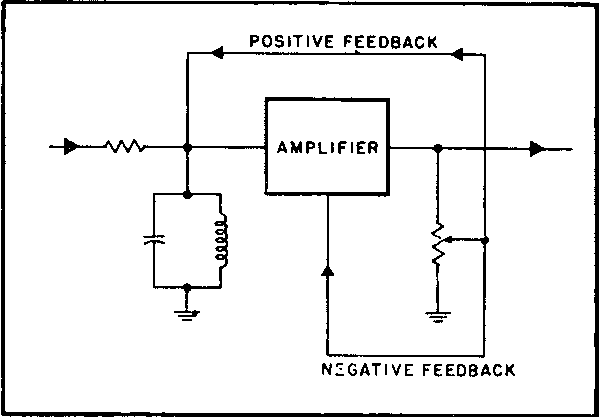
Figure 11. Arrangement of Model 300 A selective amplifier.
At the output of the amplifier is a vacuum tube voltmeter that measures the magnitude of the sideband. The frequency range of the wave analyzer is from approximately 30 to 16,000 cps. In order to be convenient to operate, it is desirable that the instrument have a high order of selectivity at low frequencies where the harmonics lie close together. But at high frequencies a lesser selectivity is often desirable so that the harmonics can be tuned or located with

Figure 12. Selectivity characteristics of Model 300A amplifier. Maximum selectivity of instrument is shown by inner curve. For higher frequency use, selectivity can be broadened to that shown by outer curve.
greater ease and so that the stability of the signal source need not be extreme. In the -hp- Model 300A, the selectivity is made variable through the use of a selective amplifier of special design. The fundamentals of this amplifier are shown in Figure 11.
Essentially, the amplifier uses regeneration in combination with a tuned amplifier to achieve high selectivity. In addition, degeneration is used to stabilize the circuit. However, the degree of both degeneration and re generation is made variable so as to control the bandwidth of the amplifier. By means of a single panel control, the regeneration can be increased while at the same time the degeneration is also increased. The design is such that as far as overall gain is concerned, these two feed backs approximately compensate one another, affecting only the band width (Figure 12).
From the standpoint of sensitivity, the wave analyzer must be capable of measuring the amplitude of individual harmonic components at low levels as well as the amplitude of a fundamental at a relatively high level. Thus, the Model 300A is designed to have a full scale reading on voltages as low as 1 millivolt. The least sensitive range has a full scale reading of 500 volts. Brunton Bauer
1 W. J. Warren and W. R. Hewlett, "An Analysis of the Intermodulation Method of Distortion Measurement," Proc. I.R.E., vol. 36, pp. 457-466; April, 1948.
To thank the Author because you find the post helpful or well done.